A United States economic calendar is a structured tool that helps users track scheduled economic releases that influence financial markets across the world. It presents upcoming and past economic events in a clear format so that traders, analysts, and investors can understand how economies are performing over time.
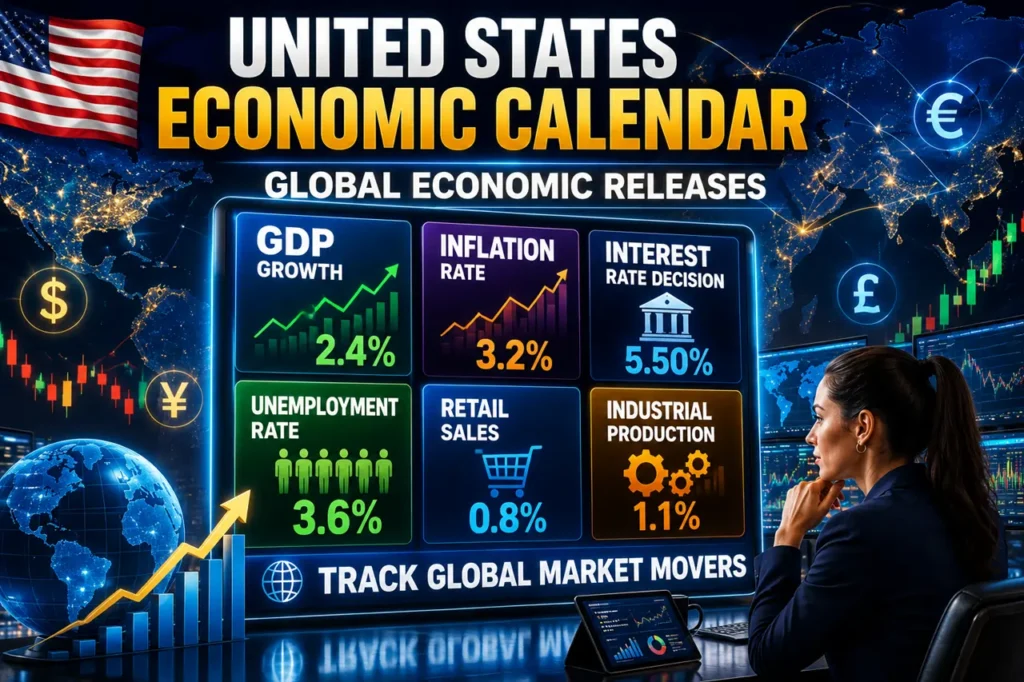
By organizing key macroeconomic data in one place, it becomes easier to monitor shifts in inflation, employment, growth, and policy decisions that affect global financial conditions. The US economic calendar is widely used as a reference point because the United States economic data often has a strong influence on international markets and investor sentiment.
What an Economic Calendar Represents
An economic calendar is designed as a timeline of important economic events released by different countries. Each entry represents a scheduled announcement that can affect financial markets. These events include government reports, central bank decisions, and major economic indicators.
The purpose of this calendar is to provide a centralized view of when economic data will be released. Instead of searching for updates across multiple sources, users can access all relevant events in one organized interface. This structure helps users stay informed about developments that may influence market movement.
The calendar typically includes events from multiple regions, allowing users to observe global economic activity side by side. This makes it useful for comparing how different economies are performing over time.
Key Components of Each Economic Event
Each listed economic event contains several important data fields that help users understand its significance.
Event Time and Date
Every economic release is scheduled at a specific time and date. This allows users to prepare for upcoming announcements and track events in real time according to their time zone.
Country or Region
The country associated with each event is clearly displayed. This helps users identify which economy the data belongs to, such as major global economies or emerging markets.
Event Name
Each entry includes the name of the economic indicator or announcement. Examples include inflation data, employment reports, or interest rate decisions. The event name gives context about what type of economic information is being released.
Actual, Forecast, and Previous Values
One of the most important features is the comparison between three values:
- Actual value: the real result after release.
- Forecast value: market expectation before release.
- Previous value: the earlier recorded data.
This comparison helps users understand whether economic conditions are improving, weakening, or staying stable.
Importance of Economic Releases in Global Markets
Economic releases play a major role in shaping financial market behavior. When new data is published, it can influence investor confidence and expectations about future economic conditions.
For example, strong economic data may indicate growth and stability, while weaker data may suggest slowing economic activity. These interpretations often lead to changes in market sentiment.
Since financial markets react quickly to new information, scheduled economic releases are closely monitored. The structured format of the calendar helps users anticipate potential volatility around key events.
Global Coverage of Economic Data
Economic calendars include data from multiple countries, allowing users to view global economic activity in one place. This helps in understanding how different regions are performing relative to each other.
Major economies often have a stronger influence on global markets due to their economic size and international trade connections. However, smaller economies are also included because their data can affect regional markets and specific sectors.
By viewing global releases together, users can identify patterns and differences between economies. This provides a broader understanding of worldwide financial conditions.
Structure of Event Importance Levels
Economic events are often categorized based on their potential market impact. This helps users quickly identify which events are more likely to cause significant market movement.
High Importance Events
These events typically have the strongest impact on financial markets. They include major indicators such as inflation reports, employment data, and central bank decisions.
Medium Importance Events
These events may influence markets but usually cause moderate movement. They often provide supporting economic insights rather than major surprises.
Low Importance Events
Low-impact events generally have a limited effect on markets. They are still useful for background economic understanding, but are less likely to cause volatility.
This classification helps users prioritize which events to focus on during analysis.
Understanding Market Reactions to Economic Data
Markets react to economic data based on how the actual results compare with expectations. If the actual value differs significantly from forecasts, it can lead to rapid price adjustments.
Positive surprises may strengthen market confidence, while negative surprises can create uncertainty. The speed of reaction often depends on how important the event is and how unexpected the result appears.
Because of this, economic calendars are used to track not only the data itself but also the timing of potential market reactions.
Filtering and Organization of Data
Economic calendars provide filtering options that allow users to customize the information they see. Users can sort events based on country, importance level, and time period.
This helps reduce unnecessary information and allows focus on relevant economic data. For example, users can choose to view only major events or focus on specific regions.
Such filtering improves clarity and makes it easier to analyze economic trends without distraction.
How Users Interpret Economic Calendars
Interpreting an economic calendar requires understanding how different types of data relate to economic performance. Users typically compare actual results with forecasts to evaluate whether an economy is performing better or worse than expected.
Consistent tracking of these releases helps users identify long-term economic trends. Over time, patterns in data such as inflation changes or employment shifts can indicate broader economic direction.
The structured layout of the calendar makes this analysis more accessible by presenting data in a clear and consistent format.
Conclusion
An US economic calendar serves as a structured system for tracking important economic releases across different countries in a unified format. It helps users compare actual, forecast, and previous values to understand how economic conditions are changing over time. By organizing events based on timing, region, and importance, it allows clearer observation of global financial activity. This structured presentation makes it easier to follow market-sensitive information and interpret economic trends effectively. Overall, it provides a consistent view of worldwide economic developments in one place.